
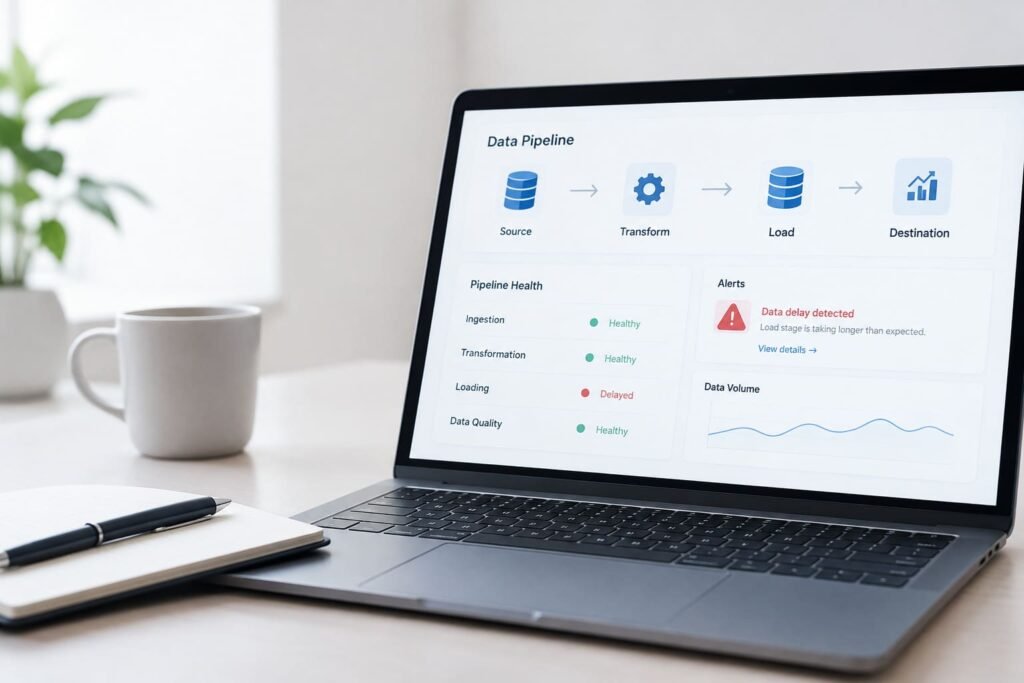
Modern businesses depend on data to understand customers, measure performance, forecast demand, and make important decisions. Behind every report, analytics dashboard, and automated process, data pipelines collect information from different sources, transform it, and deliver it to the systems that need it.
However, a pipeline can complete successfully while still delivering incomplete, outdated, or inaccurate data. A dashboard might display lower sales because some transactions were never processed. A marketing report might show fewer leads because a source system stopped sending records. These problems can remain unnoticed until someone questions the results.
Data observability helps organizations identify these hidden issues by continuously monitoring the health, reliability, and behavior of data as it moves through a pipeline. Instead of checking only whether a job has completed, teams can investigate whether the resulting data is timely, complete, consistent, and suitable for its intended purpose.
What Is Data Observability?
Data observability is the practice of monitoring and understanding the condition of data throughout its lifecycle, from the original source to its final destination. It combines data-quality checks, operational monitoring, metadata analysis, and dependency tracking to help teams detect unusual behavior and investigate its causes.
Traditional pipeline monitoring usually focuses on technical signals such as job status, execution time, and system errors. These metrics are useful, but they do not always reveal whether the data itself is correct.
For example, a daily sales pipeline may finish without producing an error, yet process only 65% of the expected transactions. The job appears successful, but the resulting report is incomplete.
Data observability helps uncover this difference between a pipeline that runs and data that can actually be trusted.
Why Hidden Data Problems Are Difficult to Detect
Data pipelines often connect multiple applications, databases, cloud platforms, and transformation processes. A problem in one component can affect several downstream systems without immediately stopping the entire workflow.
Several issues make these failures difficult to identify:
- Silent data loss: Records disappear during ingestion, filtering, or transformation without triggering a visible error.
- Unexpected delays: Data arrives later than expected, leaving reports and dashboards behind the latest business activity.
- Schema changes: A source application changes a column name, data type, or field structure, affecting downstream processing.
- Duplicate records: Repeated events or transactions inflate totals and distort business metrics.
- Unexpected value changes: Missing values, incorrect formats, or unusual distributions affect the accuracy of reports.
- Broken dependencies: An upstream dataset changes, causing problems in several tables, models, or dashboards.
These issues can be particularly challenging when a pipeline consists of many interconnected steps. Teams may know that a report is incorrect without immediately knowing which source or transformation caused the problem.
Five Important Areas of Data Observability
Effective data observability looks beyond whether a pipeline is running. It examines several signals that reveal whether data is behaving as expected.
1. Data Freshness
Data freshness measures whether information is arriving and updating according to its expected schedule.
Consider an inventory dashboard that normally refreshes every 30 minutes. If a source system stops transmitting updates, the dashboard may continue displaying old stock levels even though the pipeline has not reported a major failure.
To detect this issue, teams can monitor the time of the latest successful data arrival, compare it with expected refresh intervals, and alert the responsible team when an important dataset becomes stale.
Freshness expectations should reflect business requirements. A fraud detection system may need near-real-time data, while a monthly financial report may only require a scheduled update.
2. Data Volume
Volume monitoring checks whether the amount of incoming or processed data is reasonable for a particular period.
Suppose an online store typically processes 20,000 orders each day. One morning, its pipeline contains only 8,000 records for the same period. The difference could indicate a source outage, a failed extraction, an unexpected filter, or a genuine decline in activity.
Rather than relying on a fixed threshold alone, teams can compare current volumes with historical patterns and account for weekends, holidays, seasonal changes, and planned business events.
This helps distinguish genuine business changes from technical problems.
3. Schema Changes
A schema defines the structure of a dataset, including column names, data types, and required fields.
Imagine that a customer platform changes a field called customer_id to client_id. A downstream transformation that expects the original field may stop working correctly or produce incomplete results.
Schema monitoring can identify unexpected changes before they spread through the data environment. Teams should define which fields are essential, which changes are acceptable, and which modifications require investigation.
Not every schema change is harmful. Adding an optional field may be harmless, while removing a required identifier could break important reporting workflows.
4. Data Distribution and Quality
A dataset can contain the expected number of records and still be wrong. Distribution monitoring helps identify unusual patterns in values, while data-quality checks test specific business rules.
For example, a marketing database might suddenly contain a large percentage of blank email addresses. A financial dataset might include negative quantities where only positive values are expected. A customer analytics table might show an unexpected spike in one category.
Useful checks include:
- Monitoring null and missing-value rates.
- Identifying unexpected duplicate records.
- Validating permitted values and numerical ranges.
- Comparing important metrics against historical baselines.
- Checking relationships between related datasets.
These checks help identify changes that simple pipeline-success notifications cannot detect.
5. Data Lineage
Data lineage describes how information moves from its original source through transformations to its final destination.
Suppose a sales dashboard reports incorrect revenue. The underlying issue could originate in the payment platform, an ingestion process, a transformation model, or a reporting table.
Lineage helps teams trace the relationships between these components and determine which downstream assets may be affected by an upstream problem.
With clear lineage, engineers can investigate the likely source more efficiently, prioritize high-impact incidents, and avoid checking unrelated systems unnecessarily.
How to Detect Hidden Problems in Data Pipelines
Organizations can build a practical data observability process by following a structured approach.
Step 1: Map Critical Data Flows
Start by identifying important data sources, ingestion processes, transformation jobs, storage systems, and business dashboards.
Document which datasets support essential activities such as financial reporting, customer analytics, inventory management, and operational forecasting.
This map helps teams understand where problems could originate and which systems depend on each dataset.
Step 2: Establish Baselines for Normal Behavior
Every dataset has different expectations. A streaming event table may receive records continuously, while a finance table may update once per day.
Record normal refresh intervals, approximate row counts, processing times, null rates, and other relevant quality indicators.
Use historical data to establish realistic baselines instead of applying the same thresholds to every pipeline.
Step 3: Monitor Data and Pipeline Performance Together
Combine operational signals, such as job failures and processing delays, with data-level signals, such as row counts, freshness, schema changes, and quality-rule results.
This combined approach makes it easier to identify situations where a pipeline succeeds technically but produces an unreliable result.
Step 4: Configure Meaningful Alerts
Alerts should identify the problem, affected dataset, severity, and relevant context. For example, a notification that a critical customer table has not refreshed within its expected window is more useful than a generic message that a monitoring check failed.
Avoid alerting on every minor deviation. Excessive notifications can cause teams to overlook important incidents.
Step 5: Trace Problems to Their Source
When an alert occurs, inspect the affected dataset, recent source changes, pipeline execution logs, transformation history, and upstream dependencies.
The goal is to establish whether the issue comes from missing input, a schema change, an incorrect transformation, delayed processing, or another cause.
Step 6: Validate the Fix
After correcting the problem, verify that the missing or incorrect data has been restored and that downstream tables and reports are accurate.
A successful pipeline rerun is not enough on its own. Validation should confirm that the affected data meets the required quality and completeness expectations.
A Practical Example: Detecting Missing Sales Data
Consider an e-commerce company that relies on a daily pipeline to combine orders, payment records, and customer information.
The pipeline completes successfully, but the revenue dashboard shows a significant decline compared with the previous week.
Without data observability, the analytics team might initially assume that sales have fallen. They may spend hours investigating marketing campaigns, customer behavior, or pricing decisions.
With observability in place, the team can identify several warning signals:
- The incoming order volume is substantially lower than its historical baseline.
- The payment dataset has not received its expected update.
- Data lineage shows that the revenue dashboard depends on the affected payment table.
- Pipeline logs reveal a failed connection to the payment source.
- After the connection is restored, the team reloads the missing records and validates the revenue totals.
This example demonstrates why observing data itself is important. The pipeline’s successful status did not guarantee that the business report was complete.
Best Practices for Building a Reliable Data Observability Strategy
A useful observability strategy should fit the organization’s data architecture and business priorities rather than simply collecting as many metrics as possible.
Prioritize critical datasets. Begin with data that directly affects financial reporting, customer experiences, compliance, or essential operations.
Define measurable expectations. Establish clear objectives for freshness, completeness, accuracy, and processing time. These expectations make it easier to identify meaningful deviations.
Combine automated checks with business rules. Statistical anomaly detection can identify unexpected patterns, while explicit rules can validate requirements such as unique transaction identifiers or non-negative quantities.
Assign ownership. Every important dataset should have a responsible team or individual who can investigate alerts and coordinate fixes.
Track recurring incidents. Repeated freshness failures or quality issues may indicate deeper problems in source systems, transformation logic, or infrastructure.
Review monitoring as systems evolve. New data sources, schema changes, and business requirements can make existing checks incomplete or outdated.
Protect sensitive information. Observability often uses metadata and diagnostic logs. Apply appropriate access controls and avoid exposing personal or confidential data unnecessarily.
Data Observability vs. Data Quality Testing
Data observability and data quality testing support one another, but they serve different purposes.
Data quality testing checks whether data satisfies defined conditions. For example, a test might verify that every order has a valid identifier or that a required field is not empty.
Data observability provides a broader, ongoing view of data health. It monitors changes over time, identifies unexpected behavior, connects failures to affected dependencies, and helps teams investigate problems that predefined tests may not anticipate.
A strong data reliability strategy uses both. Quality tests validate known requirements, while observability helps reveal emerging issues and provides context for troubleshooting.
The Future of Data Observability
As organizations adopt real-time analytics, cloud data platforms, automated decision-making, and AI-powered applications, reliable data becomes increasingly important.
Observability practices are evolving toward more automated anomaly detection, dependency-aware incident analysis, and monitoring that connects technical failures with their business impact. AI-assisted tools may help teams prioritize alerts and identify likely causes, but their findings still need to be validated against actual data and system behavior.
The most effective approach combines automation with clear ownership, well-defined data expectations, and a repeatable incident response process.
Organizations do not need to monitor every dataset in the same way from the beginning. They can start with critical pipelines, establish meaningful baselines, and expand coverage as their data environment grows.
Conclusion
Hidden data problems can undermine business decisions even when pipelines appear to be operating normally. Delayed records, missing transactions, unexpected schema changes, and unusual values can all affect the reliability of analytics.
Data observability helps teams move beyond basic job monitoring by examining freshness, volume, schema, distribution, and lineage. When these signals are combined with practical quality checks and clear incident procedures, organizations can detect issues earlier, investigate them more efficiently, and improve confidence in their data.
Ultimately, the goal is not simply to keep pipelines running. It is to ensure that the information flowing through them remains reliable, timely, and useful for the decisions that depend on it.
Frequently Asked Questions
1. What is data observability?
Data observability is the process of monitoring data health, freshness, quality, and movement through pipelines to identify problems before they affect business decisions.
2. Why is data observability important?
It helps teams detect missing records, delayed updates, schema changes, and unusual data patterns, improving the reliability of analytics and reports.
3. How does data observability detect pipeline issues?
It monitors signals such as data volume, freshness, schema changes, quality metrics, and lineage to identify unexpected behavior and trace potential causes.
4. What is the difference between data observability and data quality?
Data quality checks whether information meets defined standards, while data observability continuously monitors data health and helps teams investigate emerging problems.